Reviewing my colleagues' blog posts for Week 11 was sincerely FUN! The variety of infographics designed to illustrate differentiated tasks and approaches to the three scenarios in each novel was impressive, encouraging, and motivating. We all started with the same two novels and the same three scenarios for each novel ... yet the vastly different approaches we all took to the assignment and the resulting infographics was pretty darn exciting! So...for the classroom teachers participating in #SurvivalCraft, they certainly have a plethora of options in front of them via the infographics. Beyond this, there is an important lesson about the power of visuals to convey ideas in the classroom -- to differentiate, to express information, and to engage students.

"Infographics" first crossed my radar when I began taking EDET classes in the spring of 2014. They had been making their way into my awareness via my Pinterest feeds, and I had been pinning them like crazy on several of my education-related boards. I was instantly struck by how an infographic does what new media does for learners of all ages: They take both simple and complex ideas, and organize and condense them into an intriguing, highly manageable visual display of data. Infographics are enjoyable -- they make content that could consume pages and pages of "boring" text something a reader wants to engage with and learn more about. I appreciate the way even complex information can be made accessible via a visual display -- as is true with the "Why are games good for learning?" infographic, which contains some pretty complex "stuff"!
| A quick Pinterest query of "infographic," "learning," and "education" yields hundreds of interesting infographics spanning every imaginable topic. Similarly, a Google search for "infographics education" results in thousands of hits. And an infographic about infographics (at right) provides stats and information that should encourage educators to take these visual displays of information and data very seriously. According to the "What is an Infographic?" piece, "High quality infographics are 30 times more likely to be read than text articles." In an age of visual displays with short bursts of text and information (think Twitter, Facebook, Instagram, Pinterest), infographics must be taken seriously as means by which many students gain information. If a student Googles a topic and is faced with a number of text-dense articles or websites ... or they can tackle the same information via a well-organized infographic, my guess is they will be more inclined to review the visual summary of information before they will tackle a multi-page article or text-heavy webpage. As a result, it certainly behooves teachers to brush up on creating their own infographics with easy-to-use and nifty tools like Piktochart, and then go beyond considering how they might use infographics in their instruction to having students create their own visual displays of what they have learned. What an interesting and enjoyable twist on the traditional book report, research project, or presentation the development of a content-rich infographic would be! AND the creation of an infographic requires students to tap into left-brain creative thinking that isn't necessarily a component of traditional demonstrations of learning. So...great task this week, and what a treat it was to consider my colleagues' infographics and the power of this new approach to sharing information. | 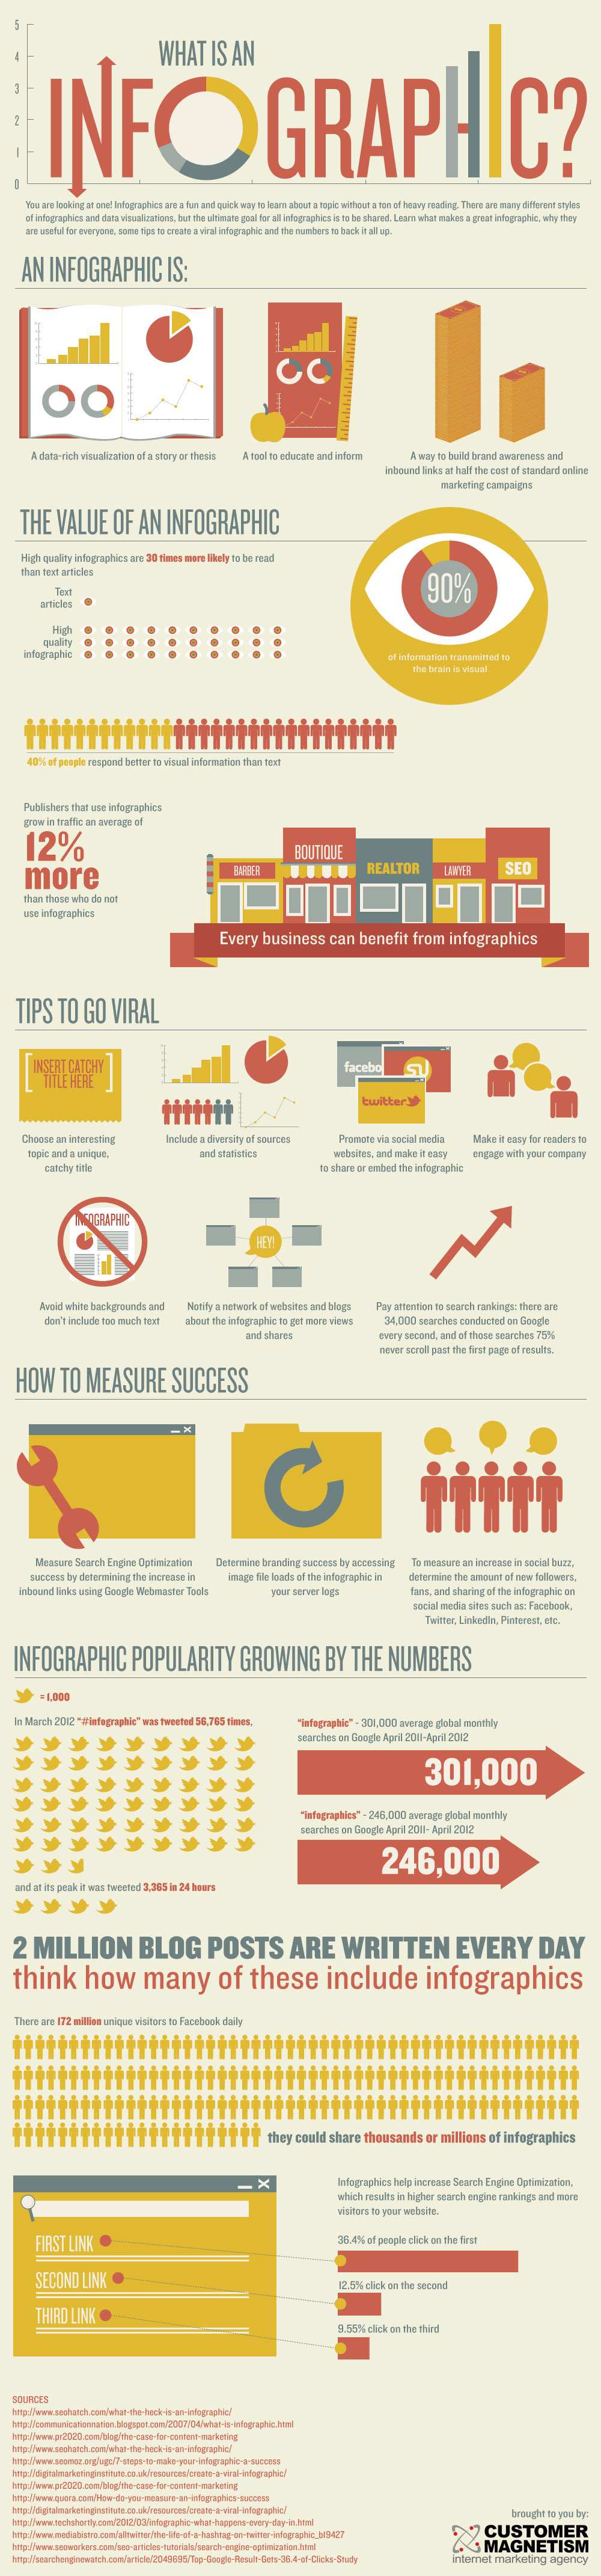 |
References:
Customer Magnetism. "What is an Infographic?" Retrieved on 10 Apr 2015 from https://www.customermagnetism.com/infographics/what-is-an-infographic/
Easelly. (2014). "Top Tips from Experts on What Makes a Great Infographic." Retrieved on 10 Apr 2015 from http://www.easel.ly/blog/top-tips-from-experts-on-what-makes-a-great-infographic/
Pinterest. Retrieved 10 Apr 2015. "Education Infographics." Retrieved 10 Apr 2015 from https://www.pinterest.com/officialascd/education-infographics/
PIXELearning. "Why are games good for learning?" Infographic. Retrieved on 10 Apr 2015 from http://www.educatorstechnology.com/2013/11/a-beautiful-visual-on-importance-of.html?utm_source=feedburner&utm_medium=feed&utm_campaign=Feed:+educatorstechnology/pDkK+(Educational+Technology+and+Mobile+Learning)
 RSS Feed