Essential Question: How will I analyze my data? Why am I making these choices?
As a very young Communications major back in the 1980s, I went door-to-door in my Midwestern college town asking people questions about political campaigns. My classmates and I interviewed those kind enough to answer a series of questions; we recorded their answers on individual sheets of paper and tried our level-best to accurately capture their responses. The true/false, multiple-choice responses were fairly easy, but open-ended survey questions were harder. Our professor asked us to record key words and phrases in participants' responses. I vividly recall the feeling of panic as I tried to remain engaged with the participant as an "active listener" while trying to write down words and phrases that seemed like they meant something. We were a bunch of undergraduates walking around recording responses on clipboards...while trying to hold the pages down in the freezing cold, howling South Dakota wind. Seems safe to say the data we collected may have been a bit skewed.
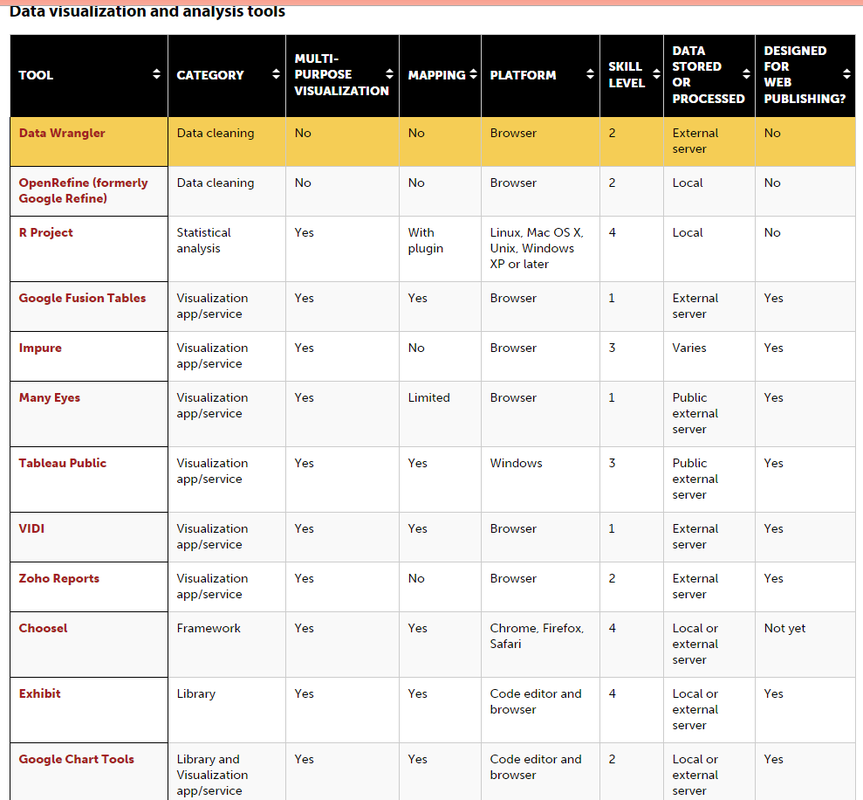
Enter 21st-Century data collection tools: The ability to deliver questions to participants via a computer removes so much of the error and bias that was inherent in having an interviewer ask the questions all of the questions. For this research project, I am using Survey Monkey to collect Phase One data. I believe this particular tool will be especially useful because it removes the uncontrollable human interviewer variable and provides built-in mechanisms for analysis. With the click of a button, I can view individual responses and summaries of responses to individual questions in graph or chart form. No more paging through individual pieces of paper to manually tally responses to basic quantitative queries. In addition, the abundance of free tools for "data visualization" is staggering. Once my data is collected, the options for turning the information into stories that reflect research discoveries is quite exciting (Machlis, 2013).
As a very young Communications major back in the 1980s, I went door-to-door in my Midwestern college town asking people questions about political campaigns. My classmates and I interviewed those kind enough to answer a series of questions; we recorded their answers on individual sheets of paper and tried our level-best to accurately capture their responses. The true/false, multiple-choice responses were fairly easy, but open-ended survey questions were harder. Our professor asked us to record key words and phrases in participants' responses. I vividly recall the feeling of panic as I tried to remain engaged with the participant as an "active listener" while trying to write down words and phrases that seemed like they meant something. We were a bunch of undergraduates walking around recording responses on clipboards...while trying to hold the pages down in the freezing cold, howling South Dakota wind. Seems safe to say the data we collected may have been a bit skewed.
Enter 21st-Century data collection tools: The ability to deliver questions to participants via a computer removes so much of the error and bias that was inherent in having an interviewer ask the questions all of the questions. For this research project, I am using Survey Monkey to collect Phase One data. I believe this particular tool will be especially useful because it removes the uncontrollable human interviewer variable and provides built-in mechanisms for analysis. With the click of a button, I can view individual responses and summaries of responses to individual questions in graph or chart form. No more paging through individual pieces of paper to manually tally responses to basic quantitative queries. In addition, the abundance of free tools for "data visualization" is staggering. Once my data is collected, the options for turning the information into stories that reflect research discoveries is quite exciting (Machlis, 2013).
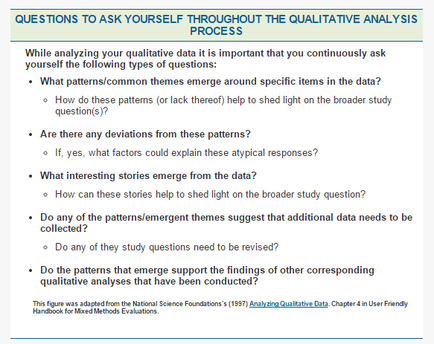
When it comes to analyzing my Phase Two / Qualitative data, I find the recommendations in The Pell Institute's Evaluation Toolkit helpful. The overarching questions I should ask myself through the qualitative analysis process, as well as the step-by-step recommendations, make the task seem more manageable.
While a mixed-methods approach increases the amount and types of data to be collected, I believe both quantitative and qualitative data are important to thoroughly address my research question. The quantitative data will provide me with a good high-level overview of online learners, their attitudes, aptitudes, and beliefs. The qualitative data, on the other hand, will allow me to dig deeper into the "how" and "why" questions that are lacking in the research. The use of a tool like Survey Monkey combined with digital recording of interviews and transcription, followed by data reduction that looks for patterns and themes, will assist me in making sense of the data.
References:
Machlis, S. (Nov. 7, 2013). Chart and image gallery: 30+ free tools for data visualization and analysis. Computerworld. Retrieved from
http://www.computerworld.com/article/2506820/business-intelligence/chart-and-image-gallery-30-free-tools-for-data-visualization-and-analysis.html
The Pell Institute and Pathways to College Network. (2014). Evaluation Toolkit: Analyze Qualitative Data. Retrieved from
http://toolkit.pellinstitute.org/evaluation-guide/analyze/analyze-qualitative-data/.

 RSS Feed